Dellin Betances’s Jedi Mind Tricks

Before his June 6th appearance  Dellin Betances had thrown his knuckle curve 255 times, and it has amassed a value of of 8 more than runs (according to fangraphs), but that is not the point of this post. Betances throws the knuckle curve a lot (48% of the time), batters can’t hit it (74% zone contact, 20% out of zone contact!, for a total contact rate of 42%), and when they do it’s very weakly (15% line drives, 55% ground balls, 10% popups, 0 home runs). It’s impressive  but not what I’m interested in.

Here’s a hint, in gif form

DBKC

Batter’s take the pitch for a called strike all the time. They swing at the curve in the strike zone a measly 29.3% of the time. This is where it gets really crazy, they swing at it out of the strike zone 36% of the time! I’ll let that sink in. This may sound hyperbolic (it’s actually hypergeometric) but a literal blind person would be expected to do better than these pros have.  There is an 83.96% chance swinging at random would beat current major league performance.

For a little math aside, you can think of this like one of those marble problems. You have a jar filled with 116 red marbles (pitches in the strike zone) and 139 green marbles (pitches outside the zone), and you pick 84 (swing at) at random. What are the chances that out of the 84 marble you chose more than 34 are red (in the strike zone)?  You can determine the probability of picking more than 34 red marbles using a hypergeometric distribution.

How is it even possible to make major league players look so confounded (see gif above)?

The worst approach at the plate (other than sabotaging yourself) is just swinging at random.  There is an 84% chance that the approach of  these players is worse than random. A possible explanation is hitters are actually trying to swing at more of the pitches outside the strike zone. This sounds like a really stupid strategy, because it is. The only reason hitters should do this is if they were able to crush the knuckle curve when it’s outside the strike zone. Hitters haven’t crushed any of the knuckle curves (an anemic .029 ISO), and they are barely ever hitting it when it’s outside the zone. It makes you wonder if Betances is using Jedi mind tricks.

draft4

Assuming that Betances is not a Jedi (if he was wouldn’t he use his powers on his fastball as well?), then something else has to be going on. From the batter’s reaction you can tell that the batter thought the pitch was going to hit him. So, maybe the batters are just so worried about the 95MPH heater that they are getting surprised by the knuckle curve? Still Betances threw the pitch 48% of the time; it’s not a surprise pitch.  Whatever it Betances is doing is definitely making hitters look dumbfounded. I don’t know of any other pitch that gets a higher swing rate out of the zone than in it (if you can think of a pitch that gets more swings out of the zone than in leave it in the comments).

Thanks to pitcher gifs for this great gif.

Also and unrelated useless fact, hitter have exactly a .000 wOBA on plate appearances ending with DB’s knuckle curve.

This is definitely something to keep an eye on and look into further.  What makes a pitch look like a ball to the batter when its in the strike zone and look like its going to be a strike when it is out of the zone. This is the only pitch I know of that can do both.


Peter O’Brien’s Raw Power: Estimating Batted-Ball Velocities in the Minor Leagues

Peter O'Brien home run on Make A Gif


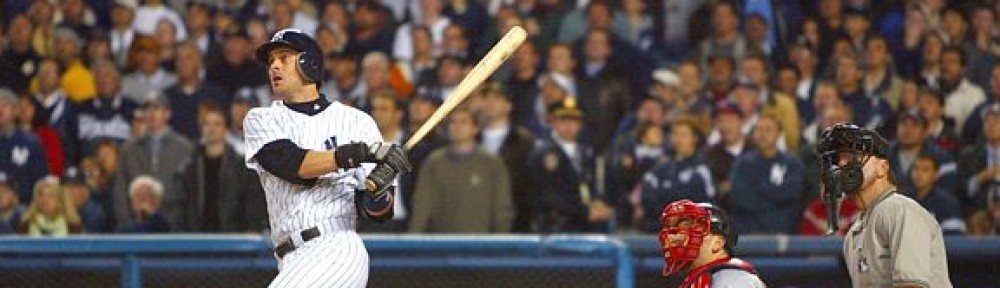
On May 20th Peter O’Brien hit a massive home run to straight away center clearing the 32 foot tall batter’s eye at Arm & Hammer Park more the 400 feet from home plate.  O’Brien is currently 1 home run behind Joey Gallo, in what looks to be an exciting competition for the minor league home run title.  O’Brien isn’t as highly touted a prospect as Gallo, but he still has some of the most impressive power in the minor leagues.  Reggie Jackson saw O’Brien’s home run and said it was one of hardest hit balls in the minor leagues that he had ever seen (and Reggie knows a thing or two about tape measure home runs).

How hard was that ball actually hit?  It is impossible to figure out exactly how hard and how far the ball was hit from the available information.  You can however use basic physics to make a reasonable estimation.

Below I explain the assumptions and thought process I used to get to an estimate of how hard the ball was hit.  If that does not interest you, then just skip to the end to find out what it takes to impress Reggie Jackson. But, if you’re curios or skeptical stick around.

OBSERVATIONS

I started off by watching the video to see what information I could gather (O’Brien’s at bat starts at the 37 second mark in the video).

TIME OF FLIGHT From the crack of the bat, to the ball leaving the park – it appears to take 5 seconds. If you watched the video, you can tell this is not a perfect measurement since the camera doesn’t track the ball very closely. If you think you have a better estimation, let me know and I’ll rework the numbers.  

LOCATION LEAVING THE PARK  The ball was hit to straight away center. From the park dimensions we know when it left the park it was 407 feet from home plate and at least 32 feet in the air to clear the batter’s eye.

ASSUMPTIONS

COEFFICIENTS OF DRAG (Cd) – The Cd determines how much a ball will slow down as it moves through the air. I chose 0.35 for the Cd because it is right in the middle of the most frequently inferred Cd values for the home runs that Alan Nathan was looking at in this paper.In looking at the Cds of baseballs, Alan Nathan showed there is reason to believe that there is some significant (meaning greater than what can be explained by random measurement error) variation in Cd from one baseball to another.

ORIGIN OF BALL I assume the ball was 3.5 feet off the ground and 2 feet in front of home plate when it was hit.  These are the standard parameters in Dr. Nathan’strajectory calculator. But what if the location is off by a foot? The effects of the origin on the trajectory are translational. One foot up, one foot higher. One foot down, one foot lower. The other observations and assumptions are more significant in determining the trajectory of the home run.

Using these assumptions and the trajectory calculator, I was able to determine the minimum speed and backspin a ball would need in order to clear the 32 foot batter’s eye 5 seconds after being hit at different launch angles.  The table below shows the vertical launch angle (in degrees), the back spin (in RMPs) and the speed of the balled ball (in MPH).

Vertical launch angle Back spin Speed off Bat
19 14121 101
21 6817 101.9
23 4155 102.75
25 2779 103.69
27 1940 104.7
29 1375 105.89
30 1156 106.5
32 805 107.88
34 536 109.4
36 322 111.1
38 149 112.99
40 4 115.1

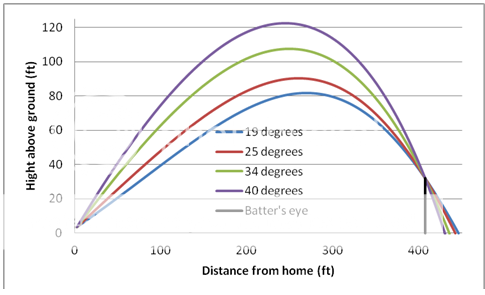
The graph shows a more visual representation of the trajectories in the table above (with the batter’s eye added in for reference).

Looking at the graph you will notice that all of these balls would be scraping the top of the batter’s eye.  This makes sense because the table shows the minimum velocities and back spins needed for the ball to exactly clear the batter’s eye.

What is the slowest O’Brien could have hit the ball?

If you were in a rush, looking at the table you would think the slowest O’Brien could have hit the ball would be 101 MPH at 19o. But, not so fast! The amount of backspin required for the ball to travel at that trajectory is humanly impossible.

What is a reasonable backspin?

I am highly skeptical of backspin values greater than 4,000 rpm based on the Baseball Prospectus article by Alan Nathan “How Far Did That Fly Ball Travel?.” The backspin on home runs Nathan examined ranged from 500 to 3,500 rpm, with most falling in around 2,000. The first 3 entries in the table have backspins of over 4,000 and can be eliminated as possibilities. If the ball with the 19olaunch angle only had 3,500 rpm of back spin it would have hit the batter’s eye less than 11 feet off the ground instead of clearing it.  Maybe you’re skeptical that I eliminated the 3rd entry because it’s close to the 4,000 rpm cut off.  Think about it this way, if a player was able to hit a ball with over 4,000 rpm of back spin, they would have to be hitting at a much higher launch angle than 23o (Higher launch angles generate greater spin while lower launch angles generate less spin).

The high launch angle trajectories with very little back spin (like the bottom three in the table) are also not very likely.  A ball hit with a 40o launch angle would almost certainly have more than 4 rpm of back spin.  If the ball hit with the 40o launch angle had 1,000 rmp of back spin (instead of 4) it would have been 70 feet off the ground, easily clearing the 32 foot batter’s eye.

Accounting for reasonable back spin, the slowest O’Brien could have hit the ball is 103.69 MPH at 25o with 2,779rpm of backspin.

So what do all these observations and assumptions get us?

We can say that the ball was likely hit 103.69 MPH or harder, with a launch angle of 25o or greater.  103.69 MPH launch velocity is not that impressive, it is essentially the league average launch velocity for a home run.  Distance wise, how impressive of a home runs was it? Unobstructed the ball would have landed at least 440 feet from home plate (assuming the 25o scenario).  The ball probably went further than 440 because it did not scrape the batter’s eye. So, how rare is a 440+ foot home run? Last year during the regular season there were 160 home runs that went 440 feet or further, there were a total of 4661 home runs that season, meaning only 3.4% of all home runs were hit at least that far.

For those of you who wanted to just skip to the end. My educated guess is that the ball went at least 440 feet and left the bat at at least 103.69 MPH.

Update * Greg Rybarczyk was kind enough to run my numbers through the hit tracker model for comparison.  The results are a 442 true distance,   25 degree vertical launch angle, and 107 MPH speed off bat. *


Article originally posted at www.fangraphs.com/community

None of this would have been possible without Alan Nathan’s great work on the physics of baseball.  I used his trajectory calculator to do this, and I referenced his articles frequently to make sure I wasn’t way making stupid assumptions. The information on major league home run distance is based off of hittrackeronline.com

Also big thanks to Greg  Rybarczyk  of hit tracker, for

Will-power?

Will Middlebrooks is a popular pick for a breakout player (at least according to the local Boston media).  Now breakouts aren’t really something you can predict, but I will not go into that whole can of worms.  On the surface Will Middlebrooks seems like an obvious choice, a young player with power, coming off a down year with no serious injury history.  The hopes for a Middlebrooks breakout upon closer inspection seem to be driven by hope and optimism rather than actual facts.

Middlebrooks’s glaring flaw last season was his sub .300 OBP (.271), which was driven in large part by his low walk rate (5.3%) and high strikeout rate (26.2%).  Believing that Middlebrooks can improve those numbers is central to any hope that he will have a breakout season.  Alex Speier  showed that it’s not unprecedented for young power hitters with sub .300 OBPs to see a large improvement in the OBP area, but it’s also not guaranteed.  Of the players Speier looked at only 18% saw their OBP increase by 30 points or more (which is what it would take to get Will over .300), so why does the Boston media believe that Middlebrooks will experience this rare transformation?

The main driving narrative behind this optimism is that Middlebrooks was over aggressive and had terrible plate discipline last year, and this allowed pitchers to dominate him. But now that he has worked on his approach at the plate during spring training everything will come together.

Continue reading

Young Power / What could have been if Miguel Sano didn’t need Tommy John surgery

Twenty-two players have hit 150 home runs or more by the age of 25 (Per baseball reference, the last season included is when a player is no older than 25 on June 30thof that season).  The list below is a who’s who of players that hit for power at a young age. You’ll notice a large number of active players have accomplished this feat, and that 10 of the 17 retired players are in the Hall of Fame.

Continue reading

Gravity (Not the Movie)

One of the great things about baseball is that it’s played in so many different ballparks, each with their own quirks and different dimensions. Much has been written about how different ballparks affect the game: the different distances of the fences, the size of the foul area, the altitude, and even what days the locals hang their laundry outside. These various park factors affect more than just the results of batted balls. They also influence the number of walks and strike outs. I want to take a look at a more esoteric park factor that has to my knowledge been ignored up to this point. Gravity. In high school you were probably told that gravity on Earth was a constant 32 ft/s2 (or 9.8 m/s2), which was actually a white lie.  To be exact, the Earth’s gravity is 32.1740 ft/s2 (or 9.80665 m/s2), but more importantly gravity is not constant.

Continue reading

Another look at Tom Glavine’s generous strike zone

Jeff Sullivan recently suggested that despite his reputation Tom Glavine did not pitch to a significantly more generous strike zone. Sullivan points out Glavine did not get significantly more called strikes than other pitchers, even during the peak of his career. Sullivan’s analysis piqued my interest and made me wonder if Glavine’s reputation for getting a wider strike zone helped him succeed in ways beyond called strikes.

Glavine’s reputation alone likely influenced a batter’s behavior at the plate, encouraging batters who were behind the count to swing at questionable pitches. Batters believed if they did not swing these pitches would be called strikes for Glavine (when a batter swings at a pitch out of the zone when the batter is ahead of the count that has more to do with a pitchers stuff than the batter giving the pitcher an expanded zone). So, what would we expect from a pitcher who is getting batters to expand the strike zone? You would expect batters to make poor contact, yielding a lower BABIP. The batter would most likely swing at pitches outside the zone when the batter is behind the count.

Based on this reasoning, I hypothesize that Tom Glavine will see a greater reduction in quality of contact when he gets ahead of the count than a league-average pitcher. I’m going to look at the time span from 1991 to 2002 because that was the time span Jeff looked at and because I like palindromes.

Continue reading

Does Fastball Velocity really matter? A look at CC Sabathia’s slowing fastball.

Does Fastball Velocity really matter? A look at CC Sabathia’s slowing fastball.

The obvious answer to this question is yes, but I was interested in how much a pitcher’s success was dependent on velocity. Bill Pettit wrote a great piece about CC Sabathia’s fastball, and I hope to shed more light on this interesting question.

(The following pitch f/x number come from Brooks Baseball, and on a technical note I believe that because Brooks Baseball uses a Y0 of 55 feet instead of 50 the fastball release speeds are slightly higher than those reported from other pitch/fx sites since they measure speed 5 feet later, so while FanGraphs says CC topped out at 96.3 mph in 2012 Brooks baseball shows him hitting 97.)

I decided to look at all the fastballs CC threw in 2012 to see how well velocity correlated with pitch value.  (One more technical note; these are my own pitch value calculations. They differ from FanGraphs in that they treat all balls in play as being worth the same.  I did this to try to remove some of the effects of defense.  Also note that the scale I’m using is runs- per- pitch and that a negative value is good for the pitcher while a positive value is good for the hitter.)  Now according to pitch f/x CC throws a four-seamer and a sinker; because pitch classifications are not perfect I looked at both four-seamers and sinkers together and then looked at them each individually to minimize any artifacts from the classification system.   [see the three graphs below]

Continue reading

Miguel Cabrera should consider himself the luckiest man on the face of the earth


Lou Gehrig famously won the Triple Crown in 1934 (but not the MPV) and even more famously in 1939 Lou stated that he considered himself “the luckiest man on the face of the earth.”  Miguel Cabrera has won the Triple Crown; he is the first winner since 1967.  While it may be hyperbolic to say that Miguel Cabrera is the luckiest man on the face of the earth, it is in no way hyperbolic to suggest that luck factored significantly with him winning the Triple Crown.  Baseball is a game of luck and skill, and whenever a player puts up fantastic numbers (like Cabrera did this year); despite how skilled the player might be there is usually some component of good luck contributing to those numbers. Continue reading